Ever felt the frustration of running a business and wondering when all the hard work will finally pay off? What if I told you there’s a simple tool that tells you exactly when your revenues will outweigh your costs? Say hello to Break-Even Analysis! Let’s break it down, step by step. Stick around till the end, and you’ll not only grasp the concept but also learn to apply it effectively!
1st. What is Break-Even Analysis?
Break-Even Analysis is a financial tool used to determine the point at which total revenues equal total costs. At this point, a business neither makes a profit nor incurs a loss—commonly referred to as the break-even point. It’s a pivotal moment that helps businesses plan their pricing, manage costs, and set realistic revenue goals.
The formula for Break-Even Point (BEP) is:
Break-Even Point (Units) = Fixed Costs / (Selling Price per Unit – Variable Cost per Unit).
Let’s break this formula into pieces:
• Fixed Costs are Expenses that remain constant, such as rent or salaries.
• Variable Costs are Costs that vary with production levels, such as raw materials.
• Selling Price per Unit is Price at which you sell your product or service.
• Contribution Margin is The difference between the Selling Price and Variable Cost, showing how much each unit contributes to covering fixed costs.
1.1. Why is Break-Even Analysis Important?
• Profit Planning: It tells you how many units you need to sell to start making money.
• Cost Control: Helps in identifying areas where costs can be minimized.
• Pricing Strategy: Guides you in setting a competitive yet profitable price.
• Risk Assessment: Gives a clear picture of the risk involved in launching a new product or service.
• Resource Allocation: Ensures efficient use of resources by aligning production with demand.
In short, it’s like the GPS for your business finances—it shows you the way!
2nd. Break-Even Chart:
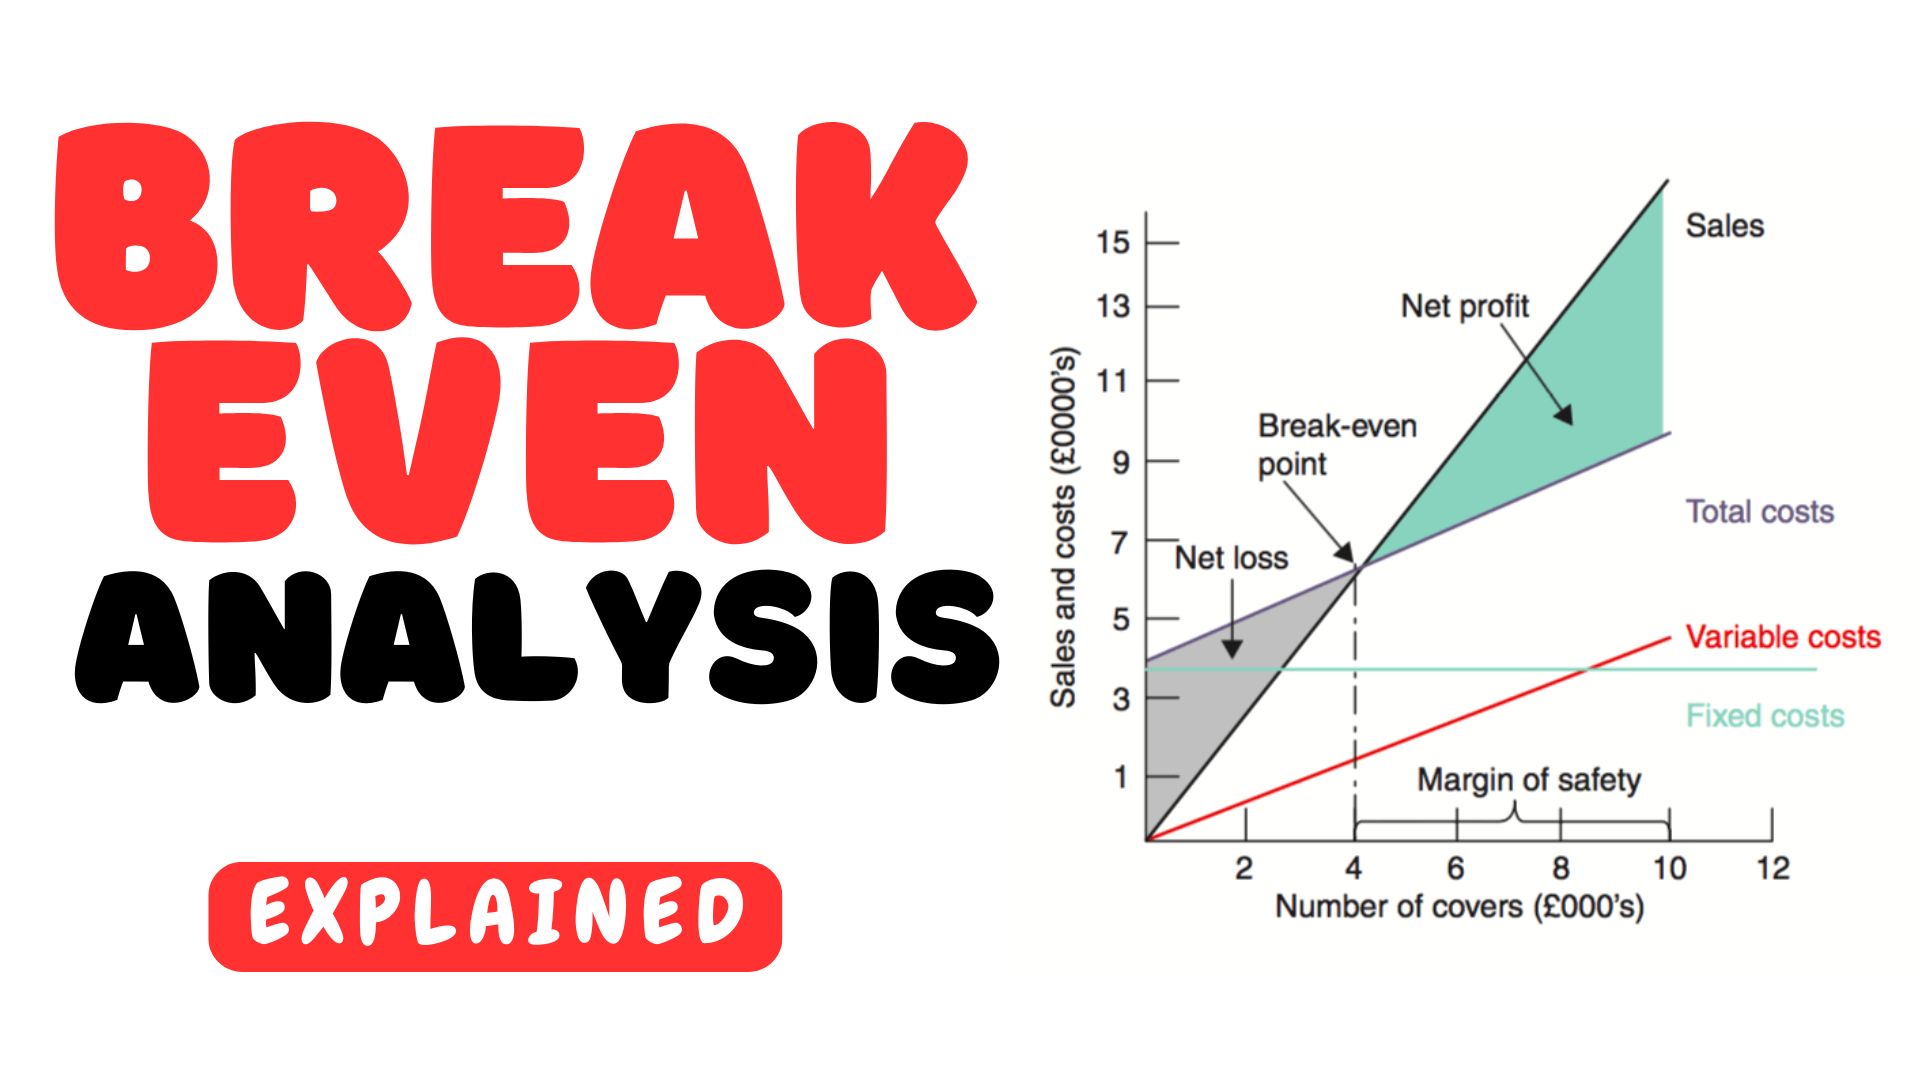
A Break-Even Chart is a visual representation of your costs, revenues, and the break-even point. It helps in identifying:
• The number of units you need to sell to cover costs.
• The relationship between costs and revenue over a range of production levels.
• Profit or loss areas beyond the break-even point.
The chart typically includes:
A horizontal axis (x-axis) showing the number of units produced or sold.
A vertical axis (y-axis) showing the monetary values of costs and revenue.
Lines representing fixed costs, total costs, and total revenue.
Breakeven Point: The point where the total costs line intersects the revenue line. This indicates the level of sales at which the company neither makes a profit nor incurs a loss.
Profit Area: The area above the breakeven point where revenue exceeds total costs, signifying profit.
Loss Area: The area below the breakeven point where total costs exceed revenue, signifying a loss.
2.1. Construction of a Break-Even Chart.
Step 1: Gather Data:
Imagine you run a home décor business. Before constructing the chart, collect these key figures:
Fixed Costs: $15,000 per month.
Variable Cost per Unit: $25.
Selling Price per Unit: $50.
Step 2: Calculate the Break-Even Point:
Using the formula:
Break-Even Point (Units) = Fixed Costs / (Selling Price – Variable Cost)
= $15,000 / ($50 – $25)
= 600 units. You need to sell 600 units to break even.
Step 3: Plot Fixed Costs:
On the graph, the x-axis represents the number of units sold, and the y-axis represents costs and revenue. Fixed Costs are a horizontal line at $15,000.
Step 4: Plot Variable Costs and Total Costs:
Variable Costs increase with production. For example:
At 200 units: $25 × 200 = $5,000.
At 600 units: $25 × 600 = $15,000.
Total Costs = Fixed Costs + Variable Costs:
At 200 units: $15,000 + $5,000 = $20,000.
At 600 units: $15,000 + $15,000 = $30,000.
Step 5: Plot Total Revenue:
Revenue = Selling Price × Units Sold:
At 200 units: $50 × 200 = $10,000.
At 600 units: $50 × 600 = $30,000.
Step 6: Mark the Break-Even Point:
The intersection of the Total Costs and Total Revenue lines at 600 units is the Break-Even Point.
2.2. Margin of Safety:
The Margin of Safety (MOS) measures the extent by which actual or projected sales exceed the break-even sales. It indicates how much sales can drop before the business starts incurring a loss.
Margin of Safety (%) = (Actual Sales – Break-Even Sales) / Actual Sales × 100
For Example:
If your actual sales are 800 units:
Break-Even Sales = 600 units.
Margin of Safety = (800 – 600) / 800 × 100 = 25%.
This means you have a safety cushion of 25%, allowing for flexibility in sales.
2.3. Angle of Incidence:
The Angle of Incidence on the Break-Even Chart is the angle between the Total Revenue line and the Total Cost line beyond the break-even point.
Significance:
• A steeper angle indicates higher profitability per unit.
• A flatter angle suggests lower profitability, requiring higher sales volume to achieve significant profit.
In our example: If each additional unit sold contributes significantly to profit, the Angle of Incidence will be steep.
Conversely, if the contribution margin is low, the angle will be less pronounced.
3rd. Real-Life Application Examples:
Example 1: Tech Startup
A SaaS (Software as a Service) company incurs high fixed costs for software development and servers. By calculating the break-even point, they know how many subscriptions they need to sell to cover their initial investment and move towards profitability.
Example 2: Retail Store
A clothing boutique launching a new product line can use Break-Even Analysis to price items competitively while ensuring the cost of inventory, marketing, and staff salaries is covered.
4th. Benefits of Break-Even Analysis:
• Clarity in Pricing: Helps set a selling price that covers costs and achieves profitability.
• Risk Mitigation: Provides insights into the viability of new products or services.
• Cost Control: Identifies areas where cost savings are needed to lower the break-even point.
• Strategic Planning: Aids in forecasting and setting realistic sales goals.
• Performance Tracking: Measures how close actual sales are to the break-even point.
5th. Limitations of Break-Even Analysis:
While it’s a powerful tool, Break-Even Analysis has its limitations:
• Static Assumptions: Assumes that costs and prices remain constant, which isn’t always the case.
• Ignores Market Dynamics: Doesn’t consider competition or market demand.
• No Time Factor: Doesn’t account for how long it takes to reach the break-even point.
• Focus on Quantities: Primarily useful for businesses that deal in tangible products.
6th. Practical Tips for Using Break-Even Analysis:
• Regular Updates: Reassess costs and revenues periodically to reflect current market conditions.
• Scenario Planning: Test different scenarios with varying costs and prices to prepare for uncertainties.
• Combine with Other Tools: Use alongside market research and competitor analysis for better decision-making.
Conclusion:
And there you have it—Break-Even Analysis, a simple yet powerful tool that gives you clarity and control over your business finances. Break-Even Analysis isn’t just about numbers; it’s about understanding your business’s financial dynamics and making informed decisions. From the formula to the chart, Margin of Safety to Angle of Incidence, each component gives you a deeper insight into your business’s health.